 International Defense Security & Technology Your trusted Source for News, Research and Analysis
Related Articles
The design, acquisition, and operation of products and systems intended for defense applications must understandably meet some of the strictest reliability standards of any industry or sector. When it comes to a mission-critical apparatus, failure of any type can lead to unacceptable and devastating consequences. For this reason, the Department of Defense’s (DoD) Reliability, Availability, and Maintainability (RAM) guidelines and the U.S. Military’s reliability prediction handbook (MIL-HDBK-217) were established. With the incredible pace of innovation in the fields of electronics and microelectronics, as well as the increasing adoption of highly sophisticated technology in military equipment, the need for enhancing defense system reliability has never been greater.
FTA and FMEA are common but fundamentally different techniques; The difference between these methods is that FMEA is a bottom-up approach that identifies all of the possible failure modes of a single component in the system
and lists the resulting consequences, whereas FTA is a top-down approach that begins with a system-level fault and works backward to identify the root causes
FTA is used in the aerospace, nuclear power, chemical and process, pharmaceutical, petrochemical and other high-hazard industries; but is also used in fields as diverse as risk factor identification relating to social service system failure. FTA is also used in software engineering for debugging purposes and is closely related to cause-elimination technique used to detect bugs.
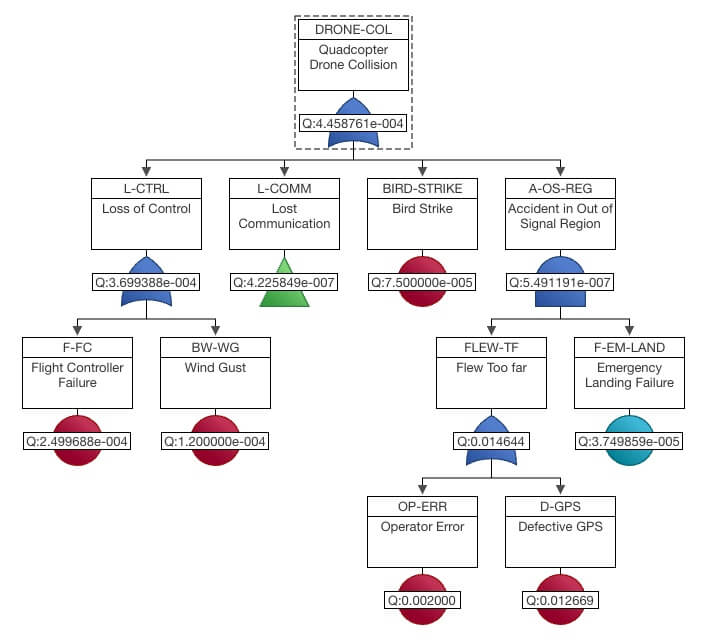
Safety-critical software must be analyzed and checked carefully. Each potential error, failure, or defect must be considered and evaluated before you release a new product. For example, if you are producing a quadcopter drone, you would like to know the probability of engine failure to evaluate the system’s reliability. Safety analysis is hard. Standards such as ARP4761 mandate several analyses, such as Functional Hazard Assessment (FHA) and Failure Mode and Effect Analysis (FMEA).
Risk Management
A risk is “a factor, thing, element, or course involving uncertain danger; a hazard.” identifying something as a risk means that the combination of the likelihood of the event and the severity of its consequences threatens the mission. Risk management is a broad term used to describe is a multi-step process to reduce both programmatic and technical risks. Programmatic risks are those that threaten the program as a whole, including high turnover of staff, a tight schedule, etc. Technical risks relate to components and subsystems.
Identify Risks or failure Modes
Failure modes, such as equipment failure, short circuits, etc., of the satellite are some examples of technical risks. The whole system has many failure modes, if it’s exposed to enough physical energy, collision, loading cycles, or a rough environment, everything can fail. Potential failures of systems are focused on by safety assessments and an analysis of potential failures aids designers to effort on and comprehending the impact of potential process or product risks and failures.
Risk management is the process of identifying issues that may be potential pitfalls to the success of a program and then creating and implementing a plan to mitigate those risks, assuring that the available resources are enough to facilitate mission success. A risk management plan first requires understanding and identifying risks.
Then, it is necessary to analyze the probability, impact, severity, and urgency of the failure modes.
Failure analysis plays an important role in the engineering design process, as failure events are expected and need to be accounted for in any design. Calculating the probability is often a difficult task given the lack of failure rate data and the early phase of the design. However, given some preliminary data on failure rates of components or subsystems, this process can be included in the risk management plan from the beginning. This data can be useful for allocating resources to the most probable failures.
Modes, effects and impacts of failures have been determined and quantified by several systematic methodologies. Failure analysis is performed to prevent system malfunctions, insure system life and prevent safety hazards while using the system. On the other hand, system quality is insured, reliability of system is achieved and customer dissatisfaction is prevented by failure analysis.
Teams should also analyze the severity, or impact on the project, of a risk occurring. The impact on the mission’s goals and other parts of the project is an important factor in determining the priority for risk mitigation. If a risk impinges on another subsystem and the relationship is not adequately understood, serious problems could occur when the risk propagates through the program. Understanding the severity of the risks will help to plan the monetary resources and the schedule of the mitigation plan according to the failure modes that will affect mission goals the most. The timeframe of the risks should be noted and monitored to ensure that all risks are dealt with before its threat becomes more serious.
Mitigation Strategy
Next, a mitigation strategy is developed to reduce risks, and decision points and testing strategies are identified to see whether failures have been eliminated. An action plan should include potential mitigation methods, the chosen approach, decision points, and tests to see whether the threat has been eliminated or reduced to an acceptable level. To verify that a risk has been mitigated may involve testing, analysis, demonstration, or observation.
All risks, including ones that have been mitigated, are then monitored and updated throughout a project’s lifecycle.
Failure Modes and Effects Analysis (FMEA)
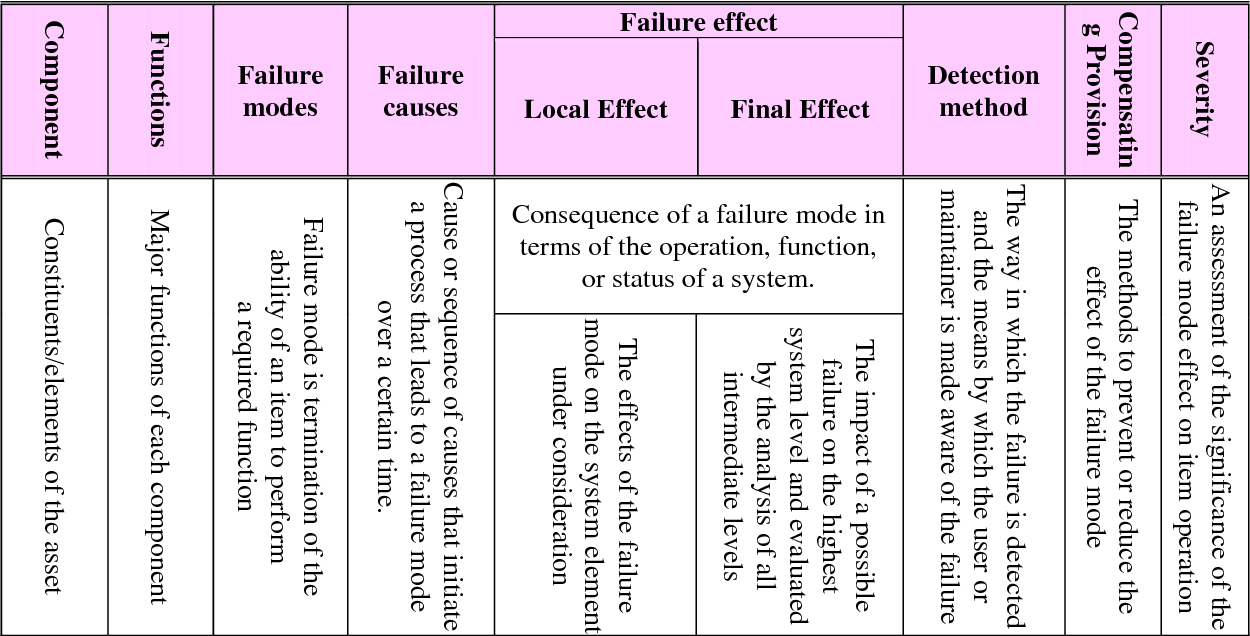
“The Failure Mode, Effects and Criticality Analysis (FMECA) is a reliability evaluation/design technique which examines the potential failure modes within a system and its equipment, in order to determine the effects on equipment and system performance. Each potential failure mode is classified according to its impact on mission success and personnel/equipment safety.” MIL-STD-1629 REV.A
Failure Modes and Effects Analysis (FMEA) is methodology for analyzing potential failures early in the development cycle where it is easier to take actions to overcome these issues, thereby enhancing reliability through design. FMEA is used to identify potential failure modes, determine their effect on the operation of the product, and identify actions to mitigate the failures.
Main steps of a FMEA can be defined like as:
- Describe the system/sub-system/component
- Draw/review a block diagram of the product
- Break down the product into its components
- List all potential failure modes for each item: The information of failure modes can be achieved from different units such as design, manufacture, assembly, quality control and installation along with using references of similar experiences
- Describe the consequences of each of the listed failure modes and assess the severity of each of these consequences on the system.
- Identify the possible cause(s) of each failure mode.
- Quantify the probability of occurrence of each of the causes of a failure mode.
- Identify all existing controls that contribute to the prevention of the occurrence of each of the causes of a failure mode.
- Determine the ability of each of the listed controls in preventing or detecting the failure mode or its cause.
- Calculate the Risk Priority Number (RPN) which is calculated via the formula;
- RPN= (Severity x Detection x Occurrence)
- Identify actions to address potential failure modes that have a high RPN
- Assign an individual responsible for implementation of the defined action(s) and a target date for completion.
- After the defined actions have been implemented the overall effect on the failure mode that the actions were supposed to address must be re-assessed and a new RPN calculated.
- The new RPN will help to determine if further action needs to be taken.
- Update the FMEA Table every time there is a significant change in the product design.
Failure effects of Satellite Communication Payload


Fault tree analysis (FTA)
Fault Tree Analysis (FTA), which provides a graphical representation of all contributors to a failure (e.g., error events and propagations). The fault tree analysis (FTA) was first introduced by Bell Laboratories and is one of the most widely used methods in system reliability, maintainability and safety analysis.
Fault tree analysis (FTA) is a graphical tool to explore the causes of system level failures. Fault Tree Analysis (FTA) is a Risk Management tool that assesses the safety-critical functions within a system’s architecture and design. It analyzes high-level failures and identifies all lower-level (sub-system) failures that cause it.
It is a deductive procedure used to determine the various combinations of hardware and software failures and human errors that could cause undesired events (referred to as top events) at the system level. It uses a graphic “model” of the pathways within a system that can lead to a foreseeable, undesirable loss event (or a failure). The pathways connect contributory events and conditions, using standard logic symbols (AND, OR, etc.).
FTA can be applied to both an existing system and to a system that is being designed. When it is applied to a system being designed for which specific data do not exist, FTA can provide an estimate of the failure probability and the important contributors using generic data to bracket the design components or concepts. FTA can also be used as an important element in the development of a performance-based design.
FTA is useful during the initial product design phase as a tool for driving the design through an evaluation of both reliability and fault probability perspectives. It can be used to estimate and develop a system’s performance reliability requirements to reduce the likelihood of undesired events from occurring.
When applied to an existing system, FTA can be used to identify weaknesses and to evaluate possible upgrades. It can also be used to monitor and predict behavior. Furthermore, FTA can be used to diagnose causes and potential corrective measures for an observed system failure.
One of the main benefits of FTA is that it shows how various combinations of events can lead to a major undesired state, and furthermore, a fault tree can reveal relationships between events across different subsystems. Because individual parts of the system are usually designed by separate teams and integrated only after each part is completed, it can be difficult to predict how the parts will interact with one another once they are incorporated into a single system. Thus, identifying how the interactions between subsystems can lead to undesired events is one of the most powerful applications of FTA
The deductive analysis begins with a general conclusion, then attempts to determine the specific causes of the conclusion by constructing a logic diagram called a fault tree. Fault tree analysis consists of two elements “events” and “logic gates” which connect the events to identify the cause of the top undesired event. It uses boolean logic to combine a series of lower level events and it is basically a top-down approach to identify the component level failures (basic event) that cause the system level failure (top event) to occur.
When you perform an FTA, you systematically determine what happens to the system when the status of a part or another factor changes. In some applications, the minimum criterion for success is that no single failure can cause injury or an undetected loss of control over the process. In others, where extreme hazards exist or when high value product is being processed, the criteria may be increased to require toleration of multiple failures.
The main purpose of the fault tree analysis is to help identify potential causes of system failures before the failures actually occur. It can also be used to evaluate the probability of the top event using analytical or statistical methods. These calculations involve system quantitative reliability and maintainability information, such as failure probability, failure rate and repair rate. After completing an FTA, you can focus your efforts on improving system safety and reliability.
Fault Tree Analysis provides insight into functional analysis of highly complex systems; Observation of combined effects of simultaneous, non-critical events on the highest level event; Evaluation of system reliability; Evaluation of human interfaces; Evaluations of software interfaces; Identification of potential design defects and safety hazards; Evaluation of corrective actions; Evaluate compliance with the (input) system safety / reliability requirements; Identification and simplification of maintenance requirements and troubleshooting procedures and Elimination of causes for observed failures
FTA is particularly useful in functional paths of high complexity in which the outcome of one or more combinations of noncritical events may produce an undesirable critical event. Typical candidates for fault tree analysis are functional paths or interfaces which could have critical impact on flight safety, munitions handling safety, safety of operating and maintenance personnel, and probability of error free command in automated systems in which a multiplicity of redundant and overlapping outputs may be involved.
Advantages of Fault tree analysis: Fault tree visually depict the analysis that will help team to work on cause of event in logical way that leads to failure. Highlights the critical components related to system failure. Provides an efficient method to analyze the system. Unlike other analysis methods, human errors are also include in the analysis. It helps to prioritize the action items to solve the problemProvides qualitative and quantitative analysis.
Fault tree also has disadvantages: The basic disadvantage is that it examine only one top event, too many gates and events to be consider for large system analysis, Common cause failures are not always obvious and difficult to capture time related and other delay factors.
FMECAs and FTAs are compatible methods of risk analysis, with the choice of method dependent on the nature of the risk to be evaluated. Fault tree analysis is an easier method than the Failure Mode and Effects Analysis (FMEA) as it focuses on all possible system failures of an undesired top event. Whereas FMEA conducts analysis to find all possible system failure modes irrespective of their severity.
There are some differences. Because FTA is a top down analysis there is a higher probability of misinterpretation at the lowest level. On the other hand, with the FMECA starting at the lowest level, it will probably result in a better method of risk analysis (assuming lowest level data is available). Also, the FMECA considers only single failures while FTA considers multiple failures which will impact accuracy.
Fault tree construction
Fault trees are built using gates and events (blocks). The two most commonly used gates in a fault tree are the AND and OR gates. As an example, consider two events (called input events) that can lead to another event (called the output event). If the occurrence of either input event causes the output event to occur, then these input events are connected using an OR gate. Alternatively, if both input events must occur in order for the output event to occur, then they are connected by an AND gate.
How do you do Fault Tree Analysis
FTA analysis involves five steps:
- Define the undesired event to study: Define the primary failure to be analyzed in other words identify the undesirable top event. Specify the problem on which the analysis will be made like open circuit, hose damage, leakage, engine stop etc. An engineer with a wide knowledge of the design of the system is the best person to help define and number the undesired events. Undesired events are used then to make FTAs. Each FTA is limited to one undesired event. Tree top Structure shall be defined:
- Obtain an understanding of the system. Once the undesired event is selected, all causes with probabilities of affecting the undesired event of 0 or more are studied and analyzed. Getting exact numbers for the probabilities leading to the event is usually impossible for the reason that it may be very costly and time-consuming to do so. Computer software is used to study probabilities; this may lead to less costly system analysis.
- Construct the fault tree.
After selecting the undesired event and having analyzed the system so that we know all the causing effects (and if possible their probabilities) we can now construct the fault tree. Fault tree is based on AND and OR gates which define the major characteristics of the fault tree. Remember, these are level two elements because they fall just below the top level failure in the tree. Link these contributors to top level event by using logical gates (AND, OR gates), and also see the relationship, so that it will help to identify the appropriate logical gate. The chain can only be terminated in a basic fault: human, hardware or software. - Evaluate the fault tree.
After the fault tree has been assembled for a specific undesired event, it is evaluated and analyzed for any possible improvement or in other words study the risk management and find ways for system improvement. In short, in this step we identify all possible hazards affecting the system in a direct or indirect way. Use the past statistical data to evaluate or predict the future performance of the system. Calculate probability of lowest level elements occurrence and also measure the probabilities from bottom up. Find the conditions in which the system is at most potential hazard and place appropriate measure and recommendations to counter with such risk. A wide range of qualitative and quantitative analysis methods can be applied. - Control the hazards identified.
This step is very specific and differs largely from one system to another, but the main point will always be that after identifying the hazards all possible methods are pursued to decrease the probability of occurrence.
Qualitative and Quantitative Evaluations of a Fault Tree
Both qualitative and quantitative evaluations can be performed on an FT. The FT itself is a qualitative assessment of the events and relationships that lead to the top event. In constructing the FT, significant insights and understanding are gained concerning the causes of the top event.
Additional evaluations serve to further refine the information that the FT provides. The qualitative evaluations basically transform the FT logic into logically equivalent forms that provide more focused information. The principal qualitative results that are obtained are the minimal cut sets (MCSs) of the top event. A cut set is a combination of basic events that can cause the top event. An MCS is the smallest combination of basic events that result in the top event. The basic events are the bottom events of the fault tree. Hence, the minimal cut sets relate the top event directly to the basic event causes. The set of MCSs for the top event represent all the ways that the basic events can cause the top event. A more descriptive name for a minimal cut set may be “minimal failure set.” The set of MCSs can not only be obtained for the top event, but for any of the intermediate events (e.g., gate events) in the FT
One of the important factors in qualitative analysis of fault tree is to identify minimal cut set. For instance complex and large fault tress have to use superior tools (algorithms for extraction) to get the minimal cut sets.
Cut set: A set of basic events that together cause the TOP undesirable event.
Minimal cut set: A cut set with minimal number of events that can still cause the TOP undesirable event. In other words the TOP undesirable event occurs if one or more minimal cut set occurs.
Top undesirable event occurs if one or more of the minimal cut set occurs, hence the main target is to identify minimal cut sets. Moreover if all the minimal cuts are independent to each other, then we could compute the probability of top undesirable event by: