 International Defense Security & Technology Your trusted Source for News, Research and Analysis
Related Articles
Remote sensing is the science of acquiring information about the Earth’s surface without actually being in contact with it. This is done by sensing and recording reflected or emitted energy and processing, analyzing, and applying that information. Some examples of remote sensing are special cameras on satellites and airplanes taking images of large areas on the Earth’s surface or making images of temperature changes in the oceans. Sonar systems on ships can be used to create images of the ocean floor without needing to travel to the bottom of the ocean.
Earth observation satellites use remote sensing technologies to monitor and assess changes in Earth’s physical, biological, and chemical compositions.The fundamental principles of remote sensing derive from the characteristics and interactions of electromagnetic radiation (EMR) as it propagates from source to sensor. The first requirement for remote sensing is to have a source of electromagnetic radiation (EMR) that illuminates or provides electromagnetic energy to the target of interest. Different sources provide different types and amounts of energy. The energy travels from its satellite to the target, passing and interacting with the atmosphere through absorption and scattering as it passes through. Once the energy makes its way to the target through the atmosphere, it interacts with the target or earth surface features depending on the properties of both the target and the radiation. After the energy has been scattered by or emitted from the target, we require a sensor (remote – not in contact with the target) to collect and record the electromagnetic radiation.
Most satellite sensors detect EMR electronically as a continuous stream of digital data. The data are transmitted to ground reception stations, processed to create defined data products commonly into images (hardcopy and/or digital), and made available for sale to users on a variety of digital data media. Once purchased, the digital image data are readily amenable to quantitative analysis using computer-implemented digital image processing techniques. The processed image is interpreted, visually and/or digitally or electronically, to extract information about the target which was illuminated.
The primary source of the energy observed by satellites is the Sun. Its energy is either reflected, as it is for visible wavelengths, or absorbed and then re-emitted for thermal infrared wavelengths. The amount of the Sun’s energy reflected depends on the roughness of the surface and its albedo, which is how well a surface reflects light instead of absorbing it. Snow, for example, has a very high albedo, reflecting up to 90% of the energy it receives from the Sun, whereas the ocean reflects only about 6%, absorbing the rest. Often, when energy is absorbed, it is re-emitted, usually at longer wavelengths. For example, the energy absorbed by the ocean gets re-emitted as infrared radiation.
Electromagnetic energy, produced by the vibration of charged particles, travels in the form of waves through the atmosphere and the vacuum of space. These waves have different wavelengths (the distance from wave crest to wave crest) and frequencies, These two are inversely related to each other, the shorter the wavelength, the higher the frequency. Some, like radio, microwave, and infrared waves, have a longer wavelength, while others, such as ultraviolet, x-rays, and gamma rays, have a much shorter wavelength.

For most purposes, the ultraviolet or UV portion of the spectrum has the shortest wavelengths which are practical for remote sensing. This radiation is just beyond the violet portion of the visible wavelengths, hence its name. Some Earth surface materials, primarily rocks and minerals, fluoresce or emit visible light when illuminated by UV radiation
Visible light sits in the middle of that range of long to shortwave radiation. The visible wavelengths cover a range from approximately 0.4 to 0.7 µm. The longest visible wavelength is red and the shortest is violet. This small portion of energy is all that the human eye is able to detect. Instrumentation is needed to detect all other forms of electromagnetic energy.
The next portion of the spectrum of interest is the infrared (IR) region which covers the wavelength range from approximately 0.7 µm to 100 µm – more than 100 times as wide as the visible portion! The infrared region can be divided into two categories based on their radiation properties – the reflected IR, and the emitted or thermal IR. Radiation in the reflected IR region is used for remote sensing purposes in ways very similar to radiation in the visible portion. The reflected IR covers wavelengths from approximately 0.7 µm to 3.0 µm. The thermal IR region is quite different than the visible and reflected IR portions, as this energy is essentially the radiation that is emitted from the Earth’s surface in the form of heat. The thermal IR covers wavelengths from approximately 3.0 µm to 100 µm. The portion of the spectrum of more recent interest to remote sensing is the microwave region from about 1 mm to 1 m. This covers the longest wavelengths used for remote sensing.
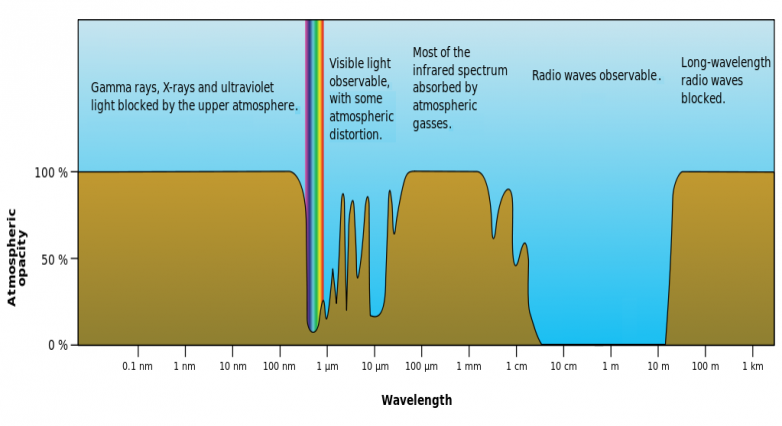
Particles and gases in the atmosphere can affect the incoming light and radiation. These effects are caused by the mechanisms of scattering and absorption. Ozone, carbon dioxide, and water vapour are the three main atmospheric constituents which absorb radiation. Because these gases absorb electromagnetic energy in very specific regions of the spectrum, they influence where (in the spectrum) we can “look” for remote sensing purposes. Those areas of the spectrum which are not severely influenced by atmospheric absorption and thus, are useful to remote sensors, are called atmospheric windows.
Radiation that is not absorbed or scattered in the atmosphere can reach and interact with the Earth’s surface. There are three (3) forms of interaction that can take place when energy strikes or is incident (I) upon the surface. These are: absorption (A); transmission (T); and reflection (R). All things on Earth reflect, absorb, or transmit energy, the amount of which varies by wavelength. In remote sensing, we are most interested in measuring the radiation reflected from targets. We refer to two types of reflection, which represent the two extreme ends of the way in which energy is reflected from a target: specular reflection and diffuse reflection.
Everything on Earth has a unique spectral “fingerprint,” just as your fingerprint is unique to you. Researchers can use this information to identify different Earth features, as well as different rock and mineral types. The number of spectral bands detected by a given instrument, its spectral resolution, determines how much differentiation a researcher can identify between materials.
Remote sensing technology
Sensors
Sensors, or instruments, aboard satellites and aircraft use the Sun as a source of illumination or provide their own source of illumination, measuring the energy that is reflected back. Sensors that use natural energy from the Sun are called passive sensors; those that provide their own source of energy are called active sensors. That’s why passive imagery is usually dependent on the day-night cycle.
Passive sensors include different types of radiometers (instruments that quantitatively measure the intensity of electromagnetic radiation in select bands) and spectrometers (devices that are designed to detect, measure, and analyze the spectral content of reflected electromagnetic radiation). Most passive systems used by remote sensing applications operate in the visible, infrared, thermal infrared, and microwave portions of the electromagnetic spectrum. These sensors measure land and sea surface temperature, vegetation properties, cloud and aerosol properties, and other physical properties. Passive sensors cannot penetrate dense cloud cover, so passive EO satellites can be limited when observing areas like the tropics with dense cloud cover.
Active sensors include different types of radio detection and ranging (radar) sensors, altimeters, scatterometers and Lidar. The majority of active sensors operate in the microwave band of the electromagnetic spectrum, which gives them the ability to penetrate the atmosphere under most conditions. However, active systems require the generation of a fairly large amount of energy to adequately illuminate targets. Some examples of active sensors are a laser fluorosensor and a synthetic aperture radar (SAR). Unlike optical satellites that capture reflected sunlight to produce detailed photos of Earth, synthetic aperture radar (SAR) satellites bounce radar signals off the ground and record the reflections to create images. This allows radar satellites to collect imagery day or night, regardless of cloud cover.
Lidar, a light detection and ranging sensor, uses a laser radar to transmit a light pulse down towards the planet’s surface. A receiver with sensitive detectors then measures the backscattered or reflected light. The distance to the object (Earth) is determined by recording the time between the transmitted and backscattered pulses. Then, by calculating the distance traveled using the speed of light. Lidar’s advantage lies in its ability to capture data in a dense field. This accuracy allows Lidar satellite systems to map forest canopies, including tree structure, and the underlying topography.
An image is a two-dimensional representation of objects in a real scene. Remote sensing images are representations of parts of the earth surface as seen from space. The images may be analog or digital. Aerial photographs are examples of analog images while satellite images acquired using electronic sensors are examples of digital images.
Digital cameras, which record electromagnetic radiation electronically, differ significantly from their counterparts which use film. Instead of using film, digital cameras use a gridded array of silicon coated CCDs (charge-coupled devices) that individually respond to electromagnetic radiation. Energy reaching the surface of the CCDs causes the generation of an electronic charge which is proportional in magnitude to the “brightness” of the ground area.
Many electronic (as opposed to photographic) remote sensors acquire data using scanning systems, which employ a sensor with a narrow field of view (i.e. IFOV) that sweeps over the terrain to build up and produce a two-dimensional image of the surface. Scanning systems can be used on both aircraft and satellite platforms and have essentially the same operating principles. A scanning system used to collect data over a variety of different wavelength ranges is called a multispectral scanner (MSS), and is the most commonly used scanning system.
A digital image comprises of a two-dimensional array of individual picture elements called pixels arranged in columns and rows. Each pixel represents an area on the Earth’s surface. A pixel has an intensity value and a location address in the two dimensional image. The intensity value represents the measured physical quantity such as the solar radiance in a given wavelength band reflected from the ground, emitted infrared radiation or backscattered radar intensity. This value is normally the average value for the whole ground area covered by the pixel.
Orbits
There are three primary types of orbits in which satellites reside: polar; non-polar, low-Earth orbit, and geostationary. Polar-orbiting satellites are in an orbital plane that is inclined at nearly 90 degrees to the equatorial plane. This inclination allows the satellite to sense the entire globe, including the polar regions, providing observations of locations that are difficult to reach via the ground. Many polar-orbiting satellites are considered sun-synchronous, meaning that the satellite passes over the same location at the same solar time each cycle.
Non-polar, low-Earth orbits are at an altitude of typically less than 2,000 km above Earth’s surface. These orbits do not provide global coverage but instead cover only a partial range of latitudes. The Global Precipitation Mission (GPM) is an example of a non-polar, low-Earth orbit satellite covering from 65 degrees north to 65 degrees south.
Geostationary satellites follow Earth’s rotation and travel at the same rate of rotation; because of this, the satellites appear to an observer on Earth to be fixed in one location. These satellites capture the same view of Earth with each observation and so provide almost continuous coverage of one area. Due to their high altitude, some geostationary weather satellites such as the Geostationary Operational Environmental Satellite (GOES) can monitor weather and cloud patterns covering an entire hemisphere of the Earth.
As a satellite revolves around the Earth, the sensor “sees” a certain portion of the Earth’s surface. The area imaged on the surface, is referred to as the swath. Imaging swaths for spaceborne sensors generally vary between tens and hundreds of kilometres wide.
Resolution
Resolution plays a role in how data from a sensor can be used. Depending on the satellite’s orbit and sensor design, resolution can vary. There are four types of resolution to consider for any dataset—radiometric, spatial, spectral, and temporal.
Temporal resolution is the time it takes for a satellite to complete an orbit and revisit the same observation area. This resolution depends on the orbit, the sensor’s characteristics, and the swath width. Because geostationary satellites match the rate at which Earth is rotating, the temporal resolution is much finer, at about 30s – 1min. Polar orbiting satellites have a temporal resolution that can vary from 1 day to 16 days.
The interval of time required for the satellite to complete its orbit cycle ( length of time required for satellite to retrace its path, passing over the same point on the Earth’s surface directly below the satellite called the nadir point) is not the same as the “revisit period“.
Also, some satellite systems are able to point their sensors to image the same area between different satellite passes separated by periods from one to five days. Thus, the actual temporal resolution of a sensor depends on a variety of factors, including the satellite/sensor capabilities, the swath overlap, and latitude. The revisit period is an important consideration for a number of monitoring applications, especially when frequent imaging is required (for example, to monitor the spread of an oil spill, or the extent of flooding).
The radiometric resolution of an imaging system describes its ability to discriminate very slight differences in energy The finer the radiometric resolution of a sensor, the more sensitive it is to detecting small differences in reflected or emitted energy. Radiometric resolution is the amount of information in each pixel, i.e. the number of bits representing the energy recorded. Each bit records an exponent of power 2. For example, an 8 bit resolution is 28, which indicates that the sensor has 256 potential digital values (0-255) to store information. Thus, the higher the radiometric resolution, the more values are available to store information, providing better discrimination between even the slightest differences in energy. For example, when assessing water quality, radiometric resolution is necessary to distinguish between subtle differences in ocean color.
Spatial resolution is defined by the size of each pixel within a digital image and the area on Earth’s surface represented by that pixel. Commercial satellites provide imagery with resolutions varying from a few metres to several kilometres. The spatial resolution of passive sensors depends primarily on their Instantaneous Field of View (IFOV). The IFOV is the angular cone of visibility of the sensor (A) and determines the area on the Earth’s surface which is “seen” from a given altitude at one particular moment in time (B). The size of the area viewed is determined by multiplying the IFOV by the distance from the ground to the sensor (C). This area on the ground is called the resolution cell and determines a sensor’s maximum spatial resolution. The finer the resolution (the lower the number), the more detail you can see.
Generally, we divide resolution into the following categories: Low resolution: over 60m/pixel; Medium resolution: 10-30m/pixel; and High to very high resolution: 30cm-5m/pixel. For example, Landsat data has 30m resolution. This means that each pixel represents a 30m x 30m area on the ground. As a result, it is considered a medium-resolution image, which can image an entire city without a level of detail that is fine enough to distinguish specific objects such as cars or houses. The striking advantage of high-resolution satellite imagery is that you can distinguish and identify small objects such as individual cars, houses, or trees. Leading commercial providers such as DigitalGlobe, Planet, and Airbus make extensive archives of the highest resolution commercially available. As new satellites launch with high-performance sensors, a new “very very high resolution” category has been defined for resolutions below 1 m.
The spectral resolution is the ability of a sensor to discern finer wavelengths, that is, having more and narrower bands. Many sensors are considered to be multispectral, meaning they have between 3-10 bands. Sensors that have hundreds to even thousands of bands are considered to be hyperspectral. The narrower the range of wavelengths for a given band, the finer the spectral resolution. For example, the Airborne Visible/Infrared Imaging Spectrometer (AVIRIS) captures information in 224 spectral channels. Their very high spectral resolution facilitates fine discrimination between different targets based on their spectral response in each of the narrow bands.
There are trade-offs between spatial, spectral, and radiometric resolution. For high spatial resolution, the sensor has to have a small IFOV (Instantaneous Field of View). However, this reduces the amount of energy that can be detected as the area of the ground resolution cell within the IFOV becomes smaller. This leads to reduced radiometric resolution – the ability to detect fine energy differences. To increase the amount of energy detected (and thus, the radiometric resolution) without reducing spatial resolution, we would have to broaden the wavelength range detected for a particular channel or band. Unfortunately, this would reduce the spectral resolution of the sensor
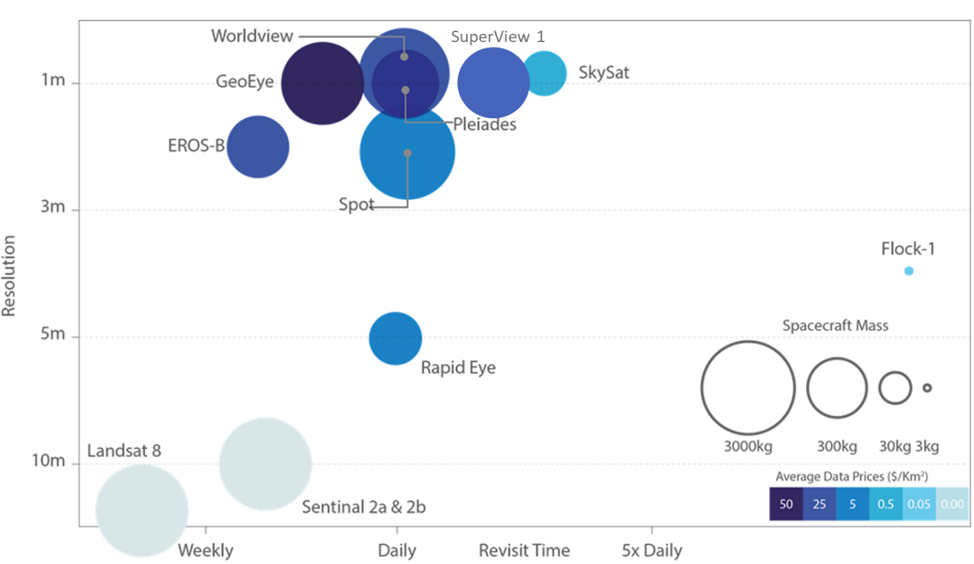
Spatial resolution vs revisit time for various satellites (Source: Satellite Applications Catapult 2017, adapted from EO21 Project)
Data Processing, Interpretation, and Analysis
Digital image processing is a subject that deals with the manipulation of images by computers. This technique has widely been used for processing the remotely sensed data in the digital form. The digital image processing requires special hardware and software, the collection of which is called the ‘Image Processing System’.
Geometric processing
Because of the earth’s rotation, the satellite orbit makes an inclination with the true north. Moreover, the image captured by the satellite sensor is the projection of the curved surface on the two dimensional plane. Thus the geometric correction of the satellite images is to be done to convert the image geometry to a preferred cartographic projection. For the data of environmental satellites like NOAA – AVHRR, the geometric correction is commonly done by the orbital information of the satellite and the characteristics of the sensor.
Image Enhancement
A digital image from the satellites may be enhanced to increase the contrast among the various features. In the initial step, the histogram of the intensity distribution is calculated. For a low contrast image, the histogram is concentrated within a small region of the gray scale. The principle of the contrast enhancement is to distribute the gray values of the original image to the full range of the gray scale ie, from 0 to 255.
Once data are processed, they can be used in a variety of applications, from agriculture to water resources to health and air quality. Any one single sensor will not address all research questions within a given application. Users often need to leverage multiple sensors and data products to address their question, bearing in mind the limitations of data provided by different spectral, spatial, and temporal resolutions.
Image Interpretation and analysis
Interpretation and analysis of remote sensing imagery involves the identification and/or measurement of various targets in an image in order to extract useful information about them. Once data are processed into imagery with varying band combinations, they can aid in resource management decisions and disaster assessment; the imagery just needs to be interpreted. Much interpretation and identification of targets in remote sensing imagery is performed manually or visually, i.e. by a human interpreter.
Digital processing and analysis may also be carried out to automatically identify targets and extract information completely without manual intervention by a human interpreter.
The ratio of distance on an image or map, to actual ground distance is referred to as scale. If you had a map with a scale of 1:100,000, an object of 1cm length on the map would actually be an object 100,000cm (1km) long on the ground. There are different scales based on the spatial resolution of the image and each scale provides different features of importance.
For example, when tracking a flood, a detailed, high-resolution view will show which homes and businesses are surrounded by water. The wider landscape view shows which parts of a county or metropolitan area are flooded and perhaps where the water is coming from. An even broader view would show the entire region—the flooded river system or the mountain ranges and valleys that control the flow. A hemispheric view would show the movement of weather systems connected to the floods.
Many features are easy to identify based on their pattern or shape. For example, agricultural areas are very geometric in shape, usually circles or rectangles. Straight lines are typically manmade structures, like roads or canals.
When using color to distinguish features, it’s important to know the band combination used in creating the image. True- or natural-color images are basically what we would see with our own eyes if looking down from space. Water absorbs light so typically it appears black or blue; however, sunlight reflecting off the surface might make it appear gray or silver. Sediment can affect water color, making it appear more brown, as can algae, making it appear more green.
Quantitative Analysis
Different land cover types can be discriminated more readily, by using image classification algorithms. Image classification uses the spectral information of each individual pixel. A program using image classification algorithms can automatically group the pixels in what is called an unsupervised classification. The user can also indicate areas of known land cover type to “train” the program to group those like pixels; this is called a supervised classification. Maps or imagery can also be integrated into a geographical information system (GIS) and then each pixel can be compared with other GIS data, such as census data.
Satellite Remote Sensing market
The global market for Satellite Remote Sensing Services is projected to reach US$ 7 billion by 2024, driven by the successful exploitation of satellite image data in a wide range of fields such as business, mining, disaster mitigation planning and recovery, weather forecasting and environmental protection, among others.
Some of the companies are Airbus Defence and Space, Ball Aerospace & Technologies Corp., Boeing Company, DigitalGlobe, Esri, ImageSat International N.V., Maxar Technologies Ltd., Mitsubishi Electric Group, Planet Labs, Inc.,
Satellite Imaging Corporation (SIC), Thales Group, UrtheCast
References and resources also include:
https://earthdata.nasa.gov/learn/backgrounders/remote-sensing